Query Bitcoin Order book from CoinMetrics API
Disclaimer: This article is part of the open educational resources for the interdisciplinary course entitled “Econ 211 Intelligent Economics: An Explanable Approach” instructed by Prof. Luyao Zhang at Duke Kunshan University (DKU)[1], Autumn 2021. The author Jingwei Li, majoring in Data Science from the class of 2023 were the Teaching Assistant for this course.
Abstract
This paper introduces three data sources and how to get access to them. Afterward, one data source is picked to demonstrate how to process the data we want. Finally, data visualizations are provided, and possible research topics based on the data are proposed. This work is constructed as the following structure: 1. Introduction of the three data sources; 2. How to import the sample data. 2. Data visualization and economic stories. The complete code and detailed instructions can be found in the Google Colab Notebook (Li 2021, Source: URL). The structure of this work is shown in Figure 1.
Figure 1: Feature picture of the work (created by Whimsical).
Part I Introduce Data Source
In this section, we briefly introduce three data sources: Coin Metrics API (COINMETRICS, 2021), Messari API (messari.io, 2021), and Defi Pulse Data (Defi Pulse Data, 2021). For each data source, we provide a table containing the major variables of each data source.
1. Coin Metrics API
Coin Metrics is a data set that is available through a new, unified, simple-to-use API. In this tutorial, we will introduce the Coin Metrics Python API v4 client library, which is an official Python API client for Coin Metrics API v4. Coin data such as available markets, coin metrics, available frequencies are provided in the data set. We can use a free API key (community API) to get access. This open-source dataset is also updated daily on its Github (URL). For detailed information, you can go to API Client Spec for reference. Table 1 provides the major variables available in Coin Metrics API:
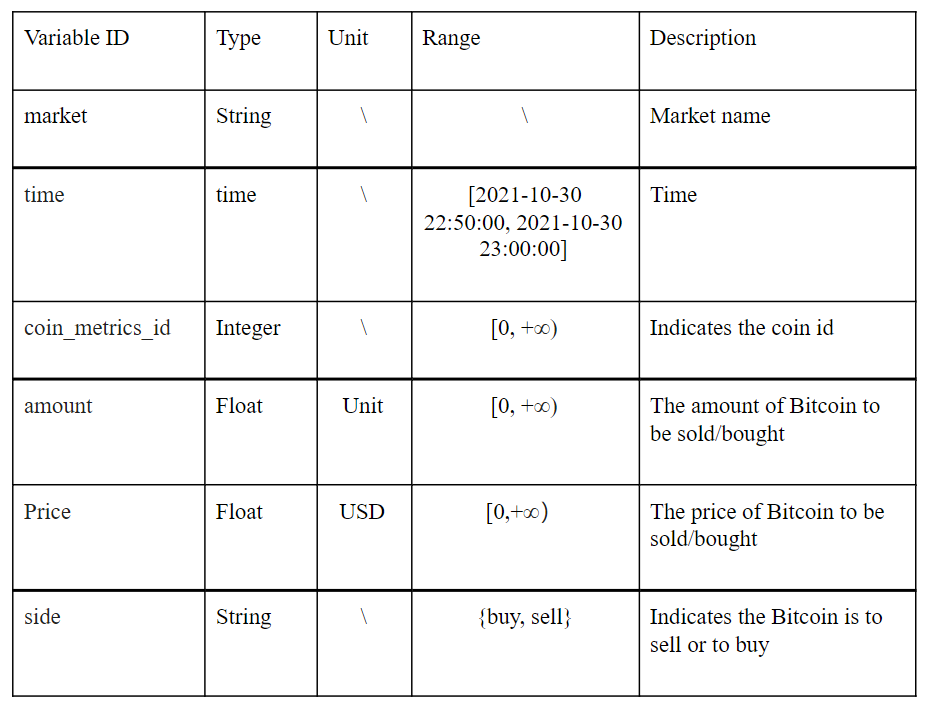 Table 1: Major variables of Coin Metrics API.
2. Messari API
Messari API can provide crypto prices, market data metrics, on-chain metrics, and qualitative information (asset profile). Messari is an open-source data set that can be accessed without an API. Besides using an API, this data resource is also updated on its Github (URL). Table 2 provides the major variables in Coin Metrics API:
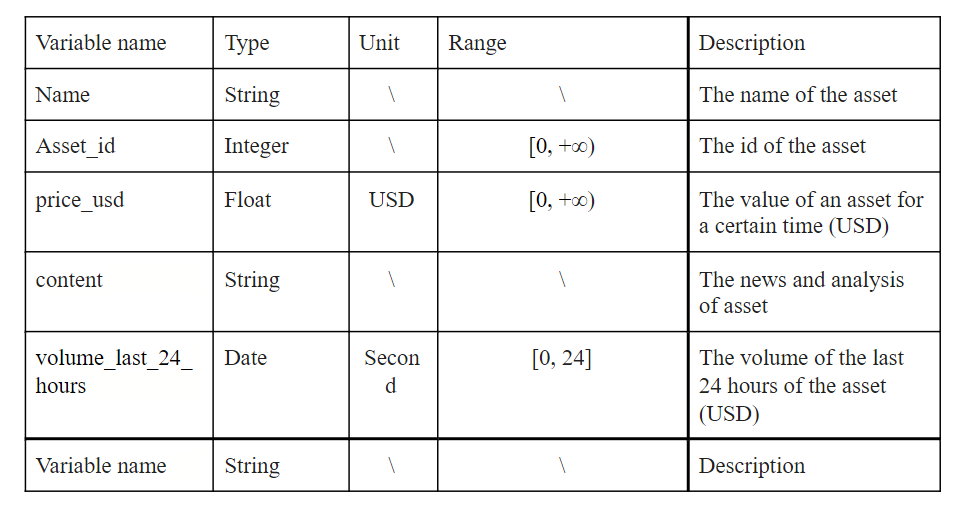 Table 2: Major variables of Messari API.
3. Defi Pulse Data
DeFi Pulse Data is a free data resource that provides Ethereum and DeFi data, which can be accessed through API. In this section, we introduce defipulsedata which is an unofficial Python SDK for the DeFi Pulse Data. DeFi Pulse provides users with 2000 API credits every month. Some of the data require API credits, for detailed information please refer to the official document. In Table 3, we provide the major variables of Defi Pulse Data. For the complete API endpoints, you can refer to this link.
 Table 3: Major indicators in Defi Pulse Data.
Figure 2 provides the decision tree for the previous three data sources we have mentioned. In the figure, we point out the recommended usage scenarios for the three datasets. It is important to point out that each of these three datasets provides a large and complete number, and their application scenarios are actually difficult to represent in a decision tree. Here we select the advantages of these three data sets. In other words, users should flexibly choose data sets according to their own needs in the actual use process.
Figure 2: Decision Tree for the three data sources (created by Whimsical).
Part II Import Sample Data
In this section, we will create a Dataframe (DF) by using the data in the Coin Metrics API which is likely to be used in future research. To be specific, we focus on the bitcoin-USD market and investigate the ordering information of this market. The section is constructed as follows: first, we introduce how to get the data and generate a pandas DF step by step; Secondly, we explain in detail the economic meaning of the variables.
1. Step-by-step instructions
we are targetting the order book data in the bitcoin-USD market (time series data). An order book is an electronic list of buy and sell orders for a specific security or financial instrument organized by price level (Kenton, 2021). The columns (features) we want to include market (market name), time (UTC), amount, price (in terms of USD), and side (buy or sell). Figure 3 provides an overview of how to generate a DF by using Coin Metrics API.
Figure 3: Step by Step Instruction to generate a DF in Coin Metrics API (created by Whimsical).
2. Economic meaning of the variables.
The processed data sets include market (market name), time (UTC), amount, price (in terms of USD), and side (buy or sell). With these features, we are able to show the trend of the selling prices and buying prices in a given period, in this case, 2021–11–05 22:50:00 to 2021–11–05 23:00:00. Table 4 shows the information of variables listed in the DF we will use. Figure 2 shows an overview of the DF we generate. Each observation is a bid to buy or sell the number of assets at a given time.
 Table 4: Information of variables listed in columns.
Figure 2: An overview of the DF.
Code 1: Code for generating the Pandas data frame
Part III Economic Stories with Data Visualization
In this section, we visualize the processed data. Figure 3 shows the BTC-USD order book in a given period. The x-axis represents the price of Bitcoin in USD while the y-axis represents the bidding amount for buyers or sellers. The red line is the selling curve, and the green one is the buying curve. Figure 3 implies that: 1. when prices increase, both amount to buy and to sell decreases. 2. The decrease in selling has an obvious lag compared to the buying curve. This is quite intuitive since people are more likely willing to sell at higher prices but not to buy.
Figure 3. BTC-USD order book in a given period.
Code 2: Code for visualizing the BTC-USD order book.
Author:
Jingwei Li
Jingwei (William) Li is a Junior student at Duke Kunshan University, majoring in Data Science. He is committed to finding connections between different disciplines and applying his knowledge in data science to address interdisciplinary research problems. He hopes his knowledge will one day make a real difference in people’s daily lives. His research interests include machine learning, deep learning, algorithm design, and green finance.
Relevant material
[1] Duke Kunshan is a world-class liberal arts university based in Kunshan, China, that offers a range of high-quality, innovative academic programs for students from around the world. It was established in September 2013 as a U.S.-China partnership between Duke University and Wuhan University.
Acknowledgments:
Executive Editors: Xinyu Tian
Supervisor and Chief Editor: Prof. Luyao Zhang