DeFi Token Initial Coin Offering
Disclaimer: This article is part of the open educational resources for the interdisciplinary course entitled “Econ 211 Intelligent Economics: An Explanable Approach” instructed by Prof. Luyao Zhang at Duke Kunshan University (DKU)[1], Autumn 2021. The author Chenyu Wang, majoring in Applied Mathematics and Computational Sciences/Math from the class of 2023 was the Teaching Assistant for this course.
Abstract
We introduced three data sources related to tokens and initial coins offering (ICO), which provided historical prices, volumes, market cap, ICO prices of different tokens. Subsequently, we showed the step-by-step instructions for the data importing process from two data sources among the three and explained the economic meaning of the data. Finally, we used the imported data to do visualization and found that tokens’ ICO prices and the tokens’ prices when they entered CoinMarketCap (CMC) may be highly linearly correlated. The code and instructions can be found in the GoogleColab Notebook as well (Wang 2021, Source: URL).
Keywords: Data source, tokens, ICO
Figure 0: Feature Photo (created by Whimsical).
Part I Introduce Data Sources
In this section, we briefly introduce three data sources: Messari (Messari’s Crypto Data API, n.d.), CoinmarketCap (CoinMarketCap, n.d), Initial Coin Offering (ICO) data from Piotr’s (2018) GitHub.
1. Messari
An application programming interface (API) is a connection between computers or between computer programs, which can help users get data without downloading it). Messari API can be used for crypto prices, market data metrics, on-chain metrics, and qualitative information (asset profiles). Most endpoints are accessible in Messari without an API key, but free API limits the amount of data users can get and the speed at which they get data. “Without an API key, requests are rate limited to 20 requests per minute and 1000 requests per day. Users that create an account will have slightly higher limits of 30 requests per minute and 2000 requests per day. PRO users have the highest limit at 60 requests per minute up to a maximum of 4000 requests per day” (Messari’s Crypto Data API, n.d). In Messari, users can utilize the Fields and Query function to get the data they want. For example, fields =’ symbol, name, slug’, and query_params = {‘start’: ‘2020–01–01’, ‘end’: ‘2020–03–01’, ‘interval’: ‘1d’, ‘columns’: ‘open, close’, ‘timestamp format: ‘rfc3339’}. Table 1 shows the sample variables of Messari API. In this unofficial PyPi package (Anwer, 2020), detailed code about Messari API can be found.
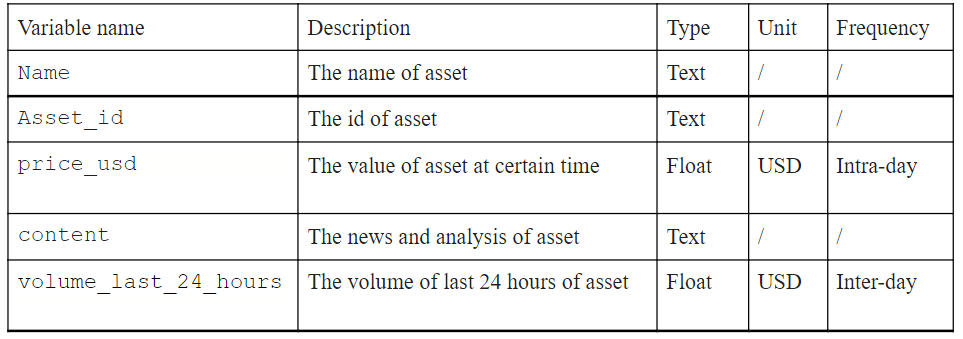 Table1: Sample variables of Messari API.
2. CoinMarketCap
CoinMarketCap (CMC)’s official website claims itself as the world’s most-referenced price-tracking website for crypto assets (CoinMarketCap, n.d), and CoinMarketCap API (Ticker Details | Reference API, n.d) can be used to get cryptocurrency data from CoinMarketCap. The price, market cap, volume of certain tokens are all available. To access it, users must have an API key, and some data can only be accessed with the paid API key, for example, users cannot get historical data with the free API. Table 2 shows the sample variables users can get for different tokens by CMC API.
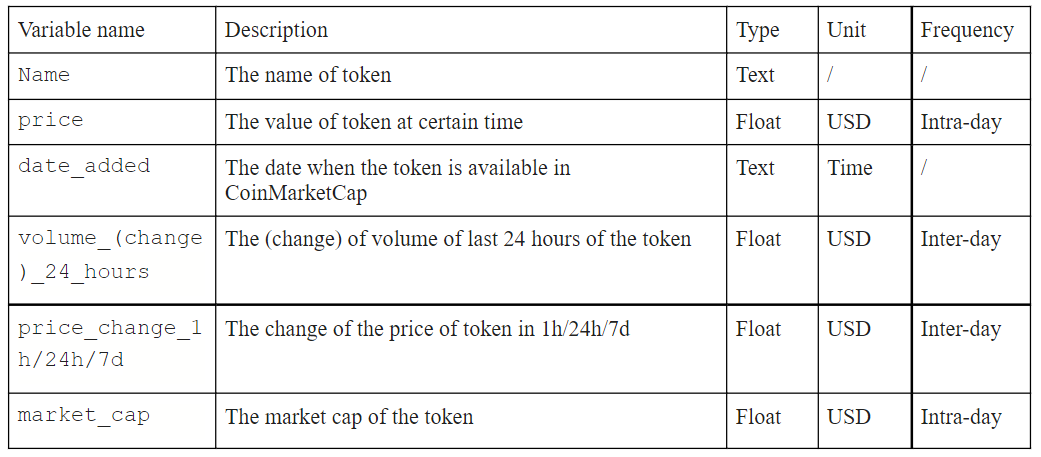 Table 2: Sample variables of CoinMarketCap API.
3. Initial Coin Offering (ICO) data from Piotr Github
The last data source is downloaded from Piotr (2018)’s blog titled “Predicting ICO returns with machine learning”. He provided the initial dataset, which includes ICO prices, number of ICO tokens, total supply ratio, and ICO Market Cap. His dataset was created based on Ian Balina (LinkedIn), his favorite ICO influencer that has a data-driven approach for selecting ICO investments. Balina collected ICO data from ICObench (ICObench, n.d.) and gave each ICO score, and Piotr added a minimum, maximum, and enter price from CoinMarketCap, and corrected a few ICO prices using data from icodrops.com (ICO drops, n.d) and tokendata.io (Tokendata research, 2021). The dataset is available on Github (URL). Table 3 shows the major data of Piotr’s dataset.
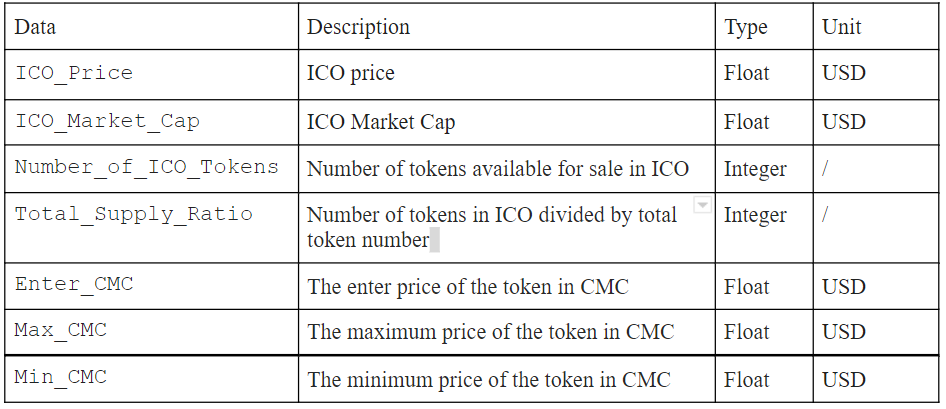 Table3: Major data of Piotr’s dataset.
Figure 1: Decision tree among these three data sources (created by Whimsical).
A decision tree is a diagram that shows the various outcomes from a series of decisions. In Fig.1, we showed a decision tree among these three data sources, which helps users to choose the suitable data source for their needs.
Part II Import Sample Data
1. Step-by-Step instruction
In Part II, we created a panda dataframe by merging Piotr’s dataset and a new dataframe created by the data from CMC for selective tokens. The final cross-section dataset includes 180 tokens such as 0x, 5 Miles, Aave, with features from Piotr’s dataset such as ICO price, ICO market cap, the price of tokens when they enter CMC, and features from CMC including the dates when tokens were added into CMC platform and the prices in CMC on Nov. 5th, 2021 (date when we merged them together). Figure 2 below provides a summary of the whole process.
Figure 2: Flow chart of the data importing and processing (created by Whimsical).
The code and instructions can be found in the GoogleColab Notebook (Wang 2021, Source: URL). The final processed data set is shown in Fig. 3.
Figure 3: Final processed data set (columns whose names are with * are from CMC). Table 4: Information of variables listed in columns (variables with * are from the CMC).
2. Economic meanings of the variables
Index: ICO project
ICO, the sales of cryptocurrency tokens to the public, to crowdfund in the technology and blockchain industries, is more and more popular these years (Cong et al., 2021). ICO projects refer to the type of token-funded projects. Before ICO, IPO (Initial Public Offering), the sale of equity to the public, was the main way to crowdfund. An IPO comes with extensive regulations via the Securities Exchange Act of 1934. Participation in an IPO is typically limited to accredited investors with over $1 million in net worth, which implies that Both issuing an IPO and participating in an IPO are highly demanding. Unlike IPO, ICO provided opportunities for any investors in the world to be involved, and most purchases are anonymous. Additionally, there are no intermediaries between coin buyers and sellers. The tokens can immediately be sold on the crypto market once they are created (Fora Financial, 2021). Therefore, high participation and efficiency are regarded as the important advantages of ICOs.
Columns:
Enter_CMC, Number of the ICO tokens, total_supply_ratio reflect the original ICO information. Enter_CMC is influenced by the time they entered CMC, so data_added is also meaningful as well. The number of the ICO tokens and total_supply_ratio indicate the ICO size. Max_CMC, Min_CMC, and ICO market cap reflect the performance of ICO later.
Code1: Code for generating the Pandas data frame.
Part III Economic Stories with Data Visualization

Figure 4: The correlation matrix of some ICO data.
To do data visualization, we chose some variables (ICO_Price, Total_Supply_Ratio, ICO_Market_Cap, Number_of_ICO_Tokens, Enter_CMC) to calculate the linear correlation coefficients, and show them by the heatmap, which is more direct. The heatmap we got is shown in Fig.4.
Referring to the heatmap, we concluded that only the Enter_CMC and ICO prices are highly linearly related, while other variables are not as linearly related since most of their linear correlation coefficients are less than 0.4. ICO prices refer to the tokens’ prices when issuing ICO. After ICO, these tokens can be bought in the crypto market instantly. CMC, as the website for price-tracking of token assets, will add these tokens soon. The prices when tokens are added into CMC are Enter_CMC. If the result is valid, one possible explanation is that intervals between ICO and the time when tokens are added into CMC are relatively small. In a short period, the differences in tokens’ performance are not that much. The entering CMC prices of most tokens will increase at a similar rate based on the ICO prices, resulting in a high linear correlation between entering CMC prices and ICO prices.
Code2: Code for generating the correlation matrix of some ICO data.
Author
Chenyu Wang
Chenyu Wang is a Junior student at Duke Kunshan University, majoring in Applied Mathematics and Computational Sciences/Math.
Relevant material
[1]Duke Kunshan is a world-class liberal arts university based in Kunshan, China, that offers a range of high-quality, innovative academic programs for students from around the world. It was established in September 2013 as a U.S.-China partnership between Duke University and Wuhan University.
Acknowledgments
Executive Editors: Xinyu Tian
Supervisor and Chief Editor: Prof. Luyao Zhang